Software Reliabilty Overview
by Walt Stoneburner
When you buy a car, often the dealership will ask you if you're interested in
purchasing a warranty. However, a warranty simply means it's affordable
to fix, not that the vehicle is reliable.
When we discuss the reliabilty of software, we can do so from different
roles. As a manager, I might want to know is the software good enough
to roll out to production and put in the hands of users. As a consumer,
I may be more interested in how long the software is going to work
correctly until the next failure.
Typically it works like this:
Step 1. Keep a log of past failures.
Step 2. Plot the failures.
Step 3. Determine a curve that best fits the observations.
Step 4. Measure how accurate your curve model is.
Step 5. Predict the future using the model.
Estimation [of the model, not future behavior] is finding the right
curve for historical data. Prediction is just that, intelligently
guessing what will happen in the future.
Complex software should be less reliable than less complex software.
High level languages should be more reliable than low level languages.
Experienced staff should produce more reliable code than less
experienced staff. Proven technologies and processes should be more
reliable than untested technologies. All these factors, and many more,
go into twiddling the shape of the curve.
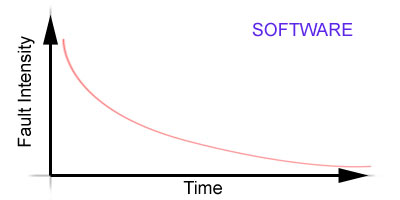
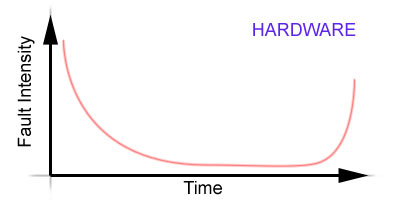
Software and hardware don't behave
the same way. The longer software is used and maintained, the higher
the degree of confidence it obtains as defects are found and weeded out.
Hardware, on the other hand, ages. Heat, oxidation, and wear take
their tolls on hardware, and even a perfectly functioning device
(like your old VCR) will eventually fail, despite how well it's treated.
A software reliabilty curve flattens out over time. A hardware
reliability curve is more U-shaped. Since a system consists of
running software on hardware, both need to be taken into account
concurrently, and for that we have the system reliability model.
Measuring Software Reliabilty is more of an art than a hard science.
The tricky part is finding a realistic curve. This isn't a matter
of making a spline that goes through all points, because what's
really being mapped is a general trend over time.
Luckily for us the field of statistics provides many tools for
generating curves and measuring their fitness to a collection of
raw data points.
Luckily for people who dislike statistics, are terrible at math,
and/or have a phobia of greek letters, there's a wonderful tool
called SMERFS. SMERFS will take collected
raw data, analyze it, try various models, tell us which is the best,
and predict future behavior based on past trends.
Note that while a model allows for incremental improvements
(such as weeding out defects), it typically does not handle
major rewrites of code or process. Curves therefore are
much better at evolutionary changes than revolutionary changes.
However, the real world does have revolutionary steps
such as massive code change, new versions, and new platforms.
In those cases, a model needs to take data from the latest version
and weight it more than historical data of prior versions. Sure
the historical trends can provide an indication of what may happen,
but they may not provide a prediction of what may happen.
The real world can be even harsher. Sometimes there is no data,
or it's inaccurate, or it's just plain missing. For this we have to
fall back to the original factors that went into the design and
make scientific wild-ass guesses from there.
There are lots of models to choose from, and what this really means
is that there are lots of equations that express different shaped
trend curves. The different models take different things into
accounts with various weightings.
Commonly, it's useful to collect things like time of failure (or
the interval between failures) and the intensity of a failure.
Failure intensity is how bad things went wrong. This can be
through some arbitrary ranking, or it can be an aggregate total
number of failures over a given time period.
A failure is when the software and/or hardware doesn't do what
it should when it should. This is due to a fault.
There's a difference between a failure and a fault. A failure
is the a crashing into a tree. The fault is the steering wheel
wasn't screwed on at the factory, the driver fell asleep while
driving, or the roads were covered in ice. Faults can be
product defects, user related, or environment related. Failure
is what happens when the fault shows itself during operation.
Note that we're trying to track new, unexpected failures. If we
notice the steering wheel isn't screwed on tightly, that doesn't
count. If we noticed it before and opt not to fix it right
now, we don't count the failure again. Because software shops
tend to fix things in batches and then release them, the actual
raw data appears as a stair-step. The model's curve, however,
demonstrates what an instanteous fix would look like the moment
a fault is discovered.
By measuring the whats and whens of a failure, it possible to
calculate things like the mean time to failure, the number of
failures at a given point at time, or at what point in time
there will be some specific number of failures left to occur.
It's doubtful any model or methodology is going to be 100% accurate,
however it is possible to get a statistically strong
confidence level by which make a sound decision.
|